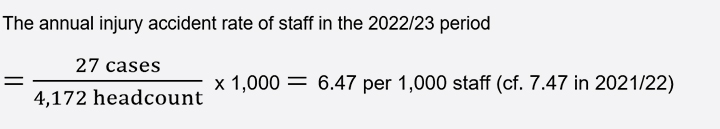
The headcount of staff includes the numbers of both full-time and part-time employees and is taken as the largest size of employment during the 12-month period. The information of headcount was published in the PAIR portal maintained by OIDR.
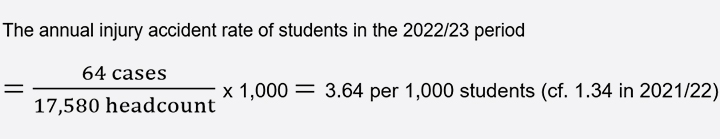
The headcount of students is taken as the largest size of enrollment during the 12-month period. The information of headcount was published in the PAIR portal maintained by OIDR.
The annual injury accident rate of contractors is not provided since the headcount of contractors was not known.
Monitoring Annual Injury Accident Rates with Control Charts
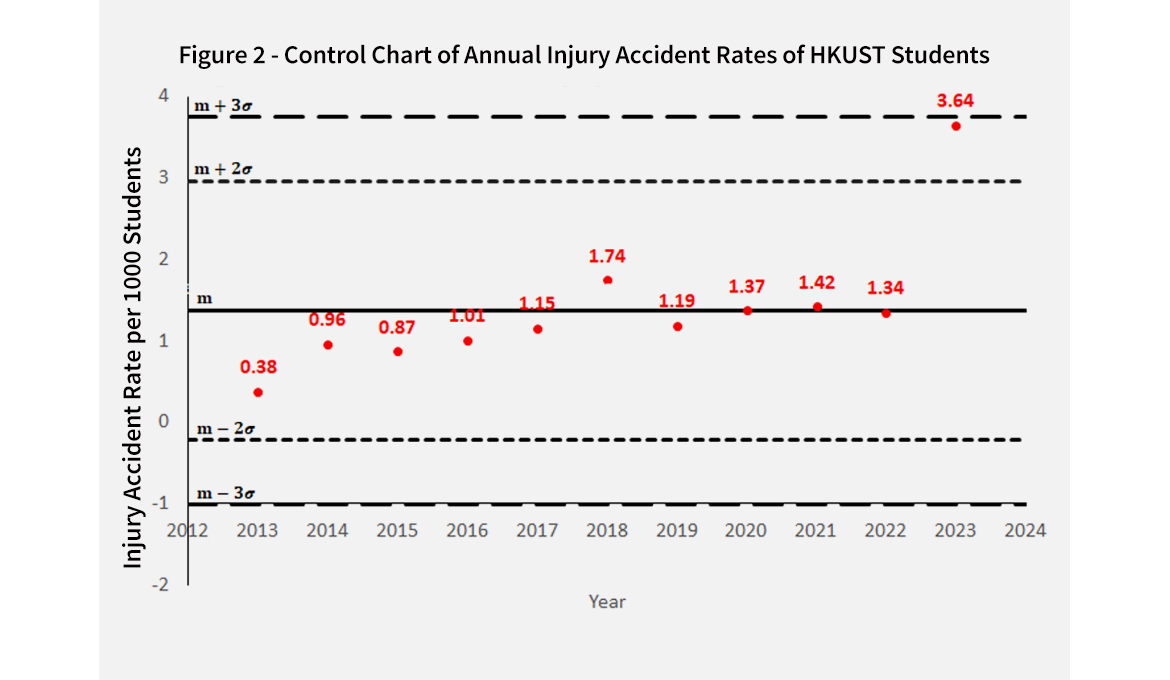
An annual rate is expressed in the number of injury accidents per 1,000 staff or students. This is a standard way to tidy up the annual rates to monitor the trends over time. The control charts of annual injury accident rates of staff and students in the previous ten years are shown in Figures 1 and 2 respectively.
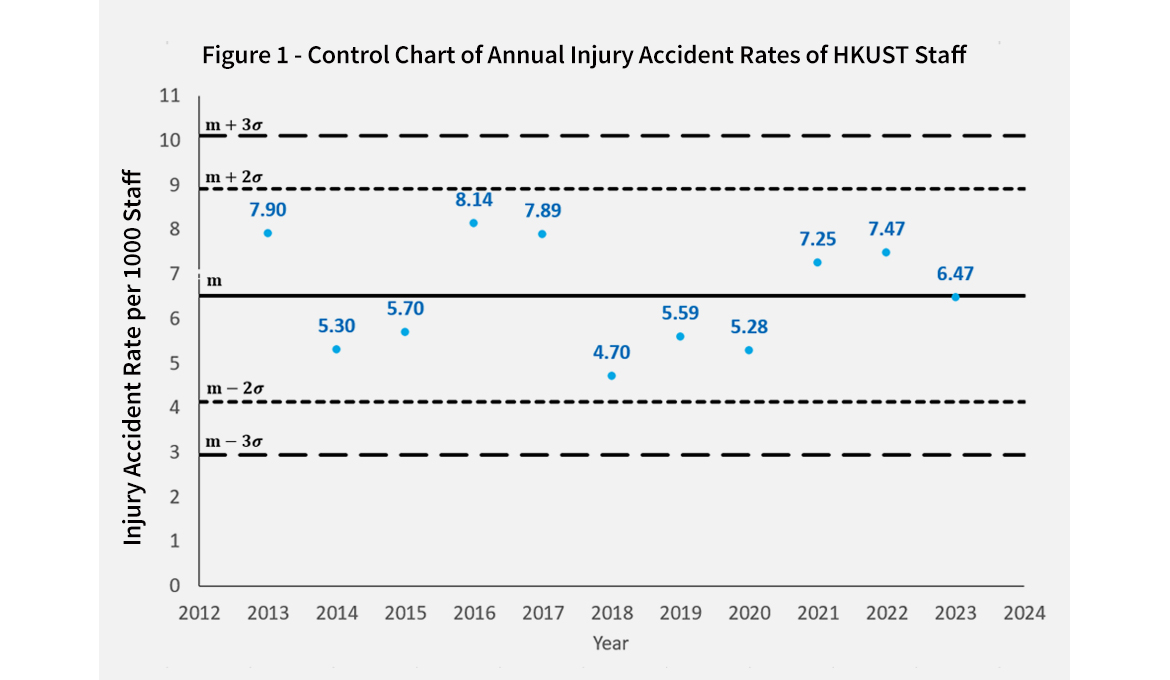
The safety system, concerning annual injury accident rates, is regarded as being out of control if at least one of the following occurs(3):
- One point lies beyond three standard deviations of the mean (the 3σ level).
- Two of three consecutive points lie beyond the 2σ level on same side of the mean (m).
- Seven consecutive points lie on one side of the mean.
- Seven consecutive points are monotonically increasing or decreasing.
Note: (3) Reference: Prevette, Professional Safety, ASSE, May 2006, pp34-41
The control charts in Figures 1 and 2 provide a non-subjective approach to monitor the trends of the annual injury accident rates over time. No ‘anomaly’ has been identified so far. If, however, the control chart indicates that a safety system is out of control, the reasons behind the ‘anomaly’ should be investigated in order to identify any good or poor practices and determine the necessary follow-up actions.

Lost Workdays
In the 2022/23 period, a total of 643 lost workdays resulted from work/study/research-related injuries:
- 239 lost workdays of staff (cf. 250 in 2021/22)
- 7 lost workdays of students (cf. 7 in 2021/22)
- 397 lost workdays of contractors (cf. 534 in 2021/22)
The numbers of injuries and lost workdays among staff in 2022/23 remained similar to the previous year, 2021/22. Despite the number of student injuries being 2.8 times that of the previous year, the number of workdays lost by students is the same as the previous year.
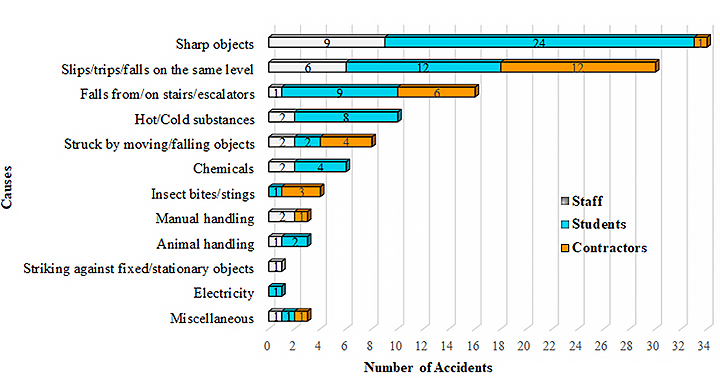
In the 2022/23 period, the most frequent causes of work/study/research-related injuries were ‘cuts/punctures by sharp objects' , 'slips/trips/falls on the same level' and ‘falls from/on stairs/escalators' , as shown in Figure 3.
Figure 3. Causes of Work/Study/Research-Related Injury Accidents in July 2022 to June 2023
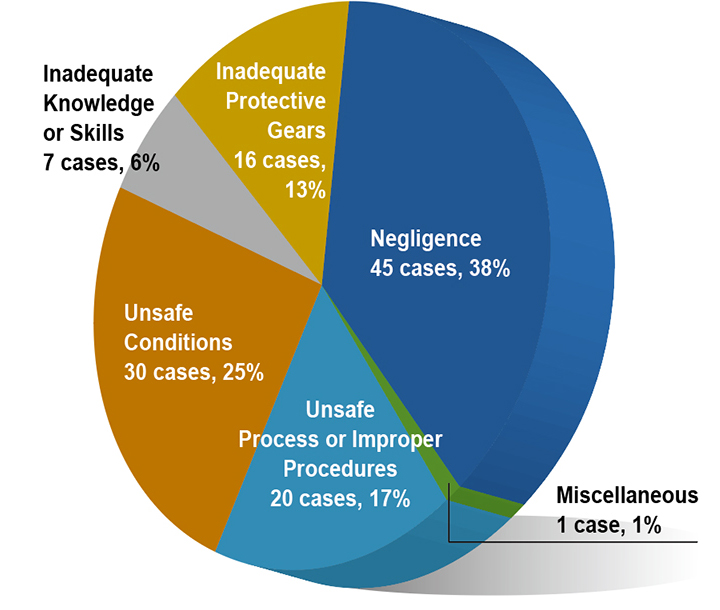
Investigations also revealed that most work/study/research-related injuries were caused by 'negligence' , as shown in Figure 4. Other common root causes included 'unsafe conditions' and 'unsafe processes or improper procedures'.
Figure 4. Root Causes of Work/Study/Research-Related Injury Accidents in July 2022 to June 2023
Non-injury Incident
In the 2022/23 period, a total of 75 non-injury incidents, which were work/study/research-related, were recorded:
- Smells or suspicious gas leakages - 25 cases
- Handling or spills of chemicals – 11 cases
- Work-at-height safety violations - 9 cases
- Fallen wall/ceiling tiles or spalling concrete - 8 cases
- Fallen trees/branches - 8 cases
- Fires - 5 cases
- Obstructions in common areas - 4 cases
- Fallen/loose bulky objects - 2 cases
- Miscellaneous - 3 cases